Main roads matter!
Main roads are the backbone of any LTN, providing mobility for all those that need to use a vehicle. Main roads will carry the through-traffic, giving residents cause to ask some serious questions. These range from ‘What is in it for me?’ to ‘Won’t the traffic on my road get worse?’ In this article we will work through these questions, provide real evidence and hopefully convince you that LTNs are better for the whole of East Oxford — wherever you live!
What do we expect?
The first thing to say is that worries over main-roads impacts are legitimate and they matter!
If the 3 LTNs increase main-roads traffic (above and beyond the regular year-on-year increase in traffic that’s happening with or without the LTNs) then this is unacceptable.
To be clear, we expect that there will be an increase in main roads traffic in the first 3-12 months of the LTNs. It can take a year to 18 months for travel patterns to adjust to a new network layout. This is one reason that the “experimental traffic regulation order” (ETRO) creating them gives the local authority up to 18 months to observe how traffic changes before having to decide whether the scheme should be made permanent or scrapped.
Once this period has passed, traffic volume on main roads should have reduced towards the level that would be expected from a normal year-on-year increase.
To some extent, one can expect the main roads’ traffic to flow better with the LTN. This is because the LTN results in fewer high-volume junctions with the main road. It has long been observed that fewer network choices leads to faster network flow. It’s known as Braess Paradox and is definitely worth a look.
LTNs are the beginning – not the end!
Even if we’re right and the main-roads traffic exhibits only a normal year-on-year increase, this is still too much! Traffic volume across the city has got to be pushed back down after decades of rise (Figure 1).
Figure 1: Passenger transport by mode, 1952-2017
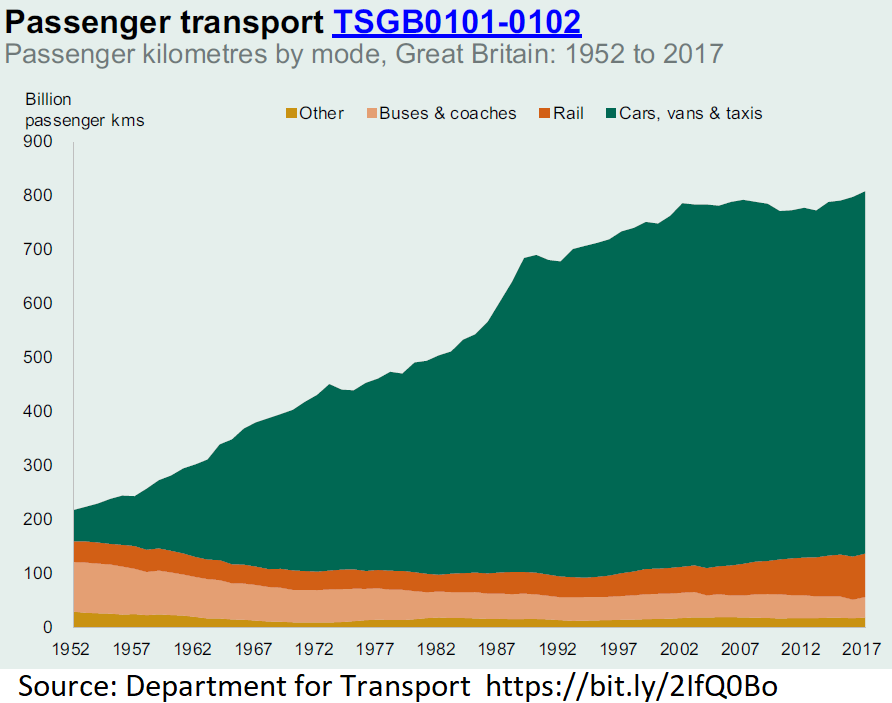
Plans to reduce overall traffic levels in Oxford must be accelerated. We support the efforts of Oxfordshire Liveable Streets, the Coalition for Healthy Streets and Active Travel and others to get the local authority to move more quickly on bold plans to reduce traffic. In particular, we want them to develop a Ghent-style plan that makes all traffic local within the ring road.
LTNs are the beginning – not the end – of this journey.
But what about London?
We’re aware of the controversies surrounding some LTN schemes in London. Lewisham borough council scrapped the Lee Green scheme and Wandsworth borough council scrapped the Tooting scheme. In both cases, the councils cited main-roads traffic as the reason for scrapping the schemes.
The concerns are valid. But might they have been mis-placed?
- In neither case were the LTNs given time to “bed in”. The 12-18 month settling-down period for the local traffic network simply wasn’t allowed. Both schemes were closed after roughly a month.
- The main roads in both areas today without the LTNs exhibit the same horrendous traffic. As has been facetiously remarked on Twitter, “It’s almost as if the number of people driving is responsible for the main-roads traffic.”
And this latter issue highlights our main learning from London:
If you want to do something about the number of trips done by private car, you have to reduce trips done by private car.
LTNs reduce car journeys and they even reduce the level of vehicle ownership.
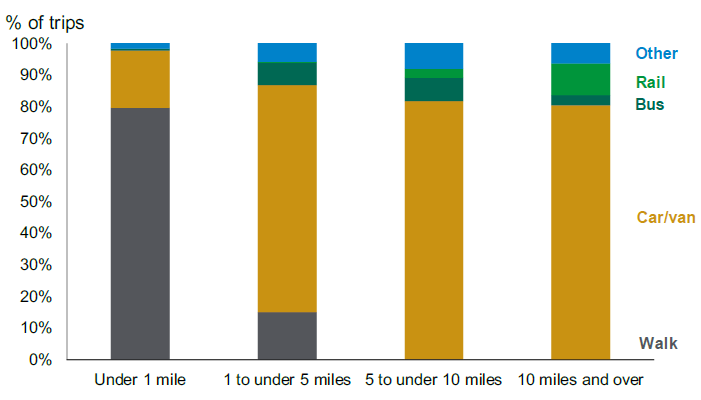
Most trips under 5 miles are done by car. Even 20% of trips of less than a mile are done by car! (Figure 2) There is, arguably, no cheaper, faster way of enabling more of these journeys to be done by active means than by installing an LTN.
Figure 2: Mode share of trips by main mode for different trip lengths: England, 2018
What do we know from earlier LTNs?
To our knowledge, the only hard data on perimeter-road traffic comes from the borough of Waltham Forest. The borough counted traffic on perimeter and interior roads for its flagship LTN (Walthamstow Village). That scheme was installed in September 2015. The pre-LTN traffic count was in September 2014. The post-LTN traffic count was in June 2016. (The scheme at that time was the only one; adjacent neighbourhoods’ schemes came in later. You can see the locations and dates of the various Waltham Forest schemes on this map developed by Paul Gasson.)
Table 1 reports an overall 15% reduction in traffic for all interior and perimeter roads. This reflects a 50% fall for the interior set against an 11% increase for the perimeter. However, we also know from the Department for Transport that traffic volume increased 4.2% between 2014-2016 for outer-London boroughs like Waltham Forest. In other words, it can be assumed that 4.2 percentage points of the 11% increase in the 2014-2016 vehicle count on Walthamstow Village LTN perimeter roads represents a background increase in traffic. The rest — 6.7% — might be associated with the LTN scheme itself.
We are clear that this 6.7% increase is too much. We only note that the count was done nine months into the scheme, whereas it could take twice that amount of time for it to ‘bed-in’.
Table 1: % change in daily vehicle count, 2014-2016, Walthamstow Village LTN
| 2014-2016 % change daily vehicle count | Amount in excess of 4.2% London 2014-2016 traffic increase* | |
| LTN (interior) | -50% | -54.2% |
| LTN (perimeter) | 11% | 6.7% |
| LTN (interior+perimeter) | -15% | -19.5% |
* Average of outer-London boroughs excluding Waltham Forest
Sources for Table 1
The percentage-change figures come from vehicle count data published in the interim monitoring report and reproduced in the final monitoring report. The 4.2% outer-London (excl WF) figure is calculated from “Traffic Flows of all vehicles and cars only” from DfT.
How do LTNs reduce private-car journeys?
LTNs combine carrot and stick to get more people switching from private-car journeys to walking or cycling. The carrot is taking out the dominance of motor traffic in the street, making it a more welcoming, inviting space to spend time in and travel upon (by bike) or near (on foot). The stick is the inconvenience that LTNs create for short car journeys. Residents think twice about “jumping in the car”.
Why should I put up with even a short-term increase in main-roads traffic?
Even in the time that it takes to get main-roads traffic back to the level that would be expected from normal year-on-year growth, residents of main roads still benefit from LTNs. Children can get to schools, parks and friends safely. Residents can get to friends, shops, places of worship, pubs and restaurants safely.
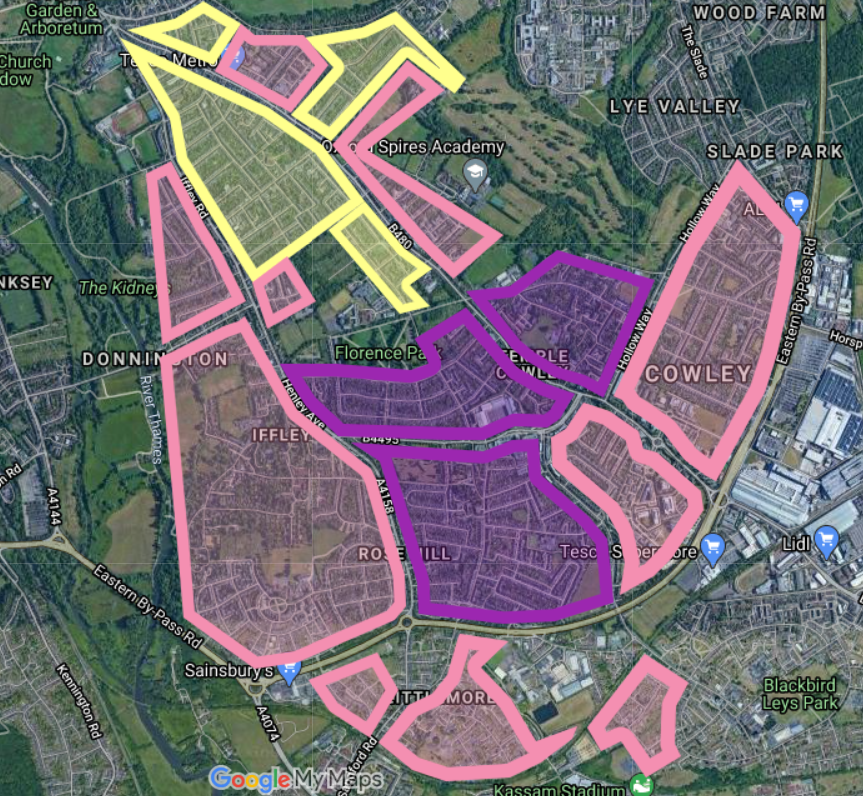
The space covered by the Cowley project is ambitious. It should enable a modal shift by plenty of residents. Our 3 LTNs:
- directly cover two square-kilometres and
- join existing LTNs covering four square-kilometres.
Within this six-square-kilometre area we count:
- Ten primary schools
- Three secondary schools
- One SEN school
- Thirteen parks
- Ten pubs
Our ask
What we ask is that you give the schemes a try and enough time to work. It will take time for the overall road network to adjust. It will take time for people to start substituting other modes for driving. Not everyone is able to walk or cycle. That’s ok. The better these schemes work, the more space they leave for those who can’t.